The Logger That Cried Slack
10 mins
There is a specific kind of 2am panic that only a backend engineer knows. You are on call. Slack is screaming. A customer cannot log in. You open the dashboard, type the transaction ID into the search bar, and the screen returns... nothing. Or worse — fourteen million log lines, none of which contain the word error, because three weeks ago someone, somewhere, decided that print(json.dumps(payload)) was a logging strategy.
This is the story of how we stopped doing that.
It is also the story of ecl_logging_utility — a private Python package that, over nineteen versions and roughly a year of patient, paranoid iteration, became the unglamorous nervous system of every ECL microservice. It is not flashy. It will never appear on Hacker News. But like good plumbing, you notice it most when it's gone.
,This post is a tour. We will start with why the thing exists at all, descend into the philosophy, into the pipes, and surface — eventually — at a singleton that recycles itself every five minutes for reasons that will become darkly amusing.
I. "Why not just use logging?"
This is the first question anyone asks. It deserves a real answer.
The Python standard library ships logging. It is mature, ubiquitous, and free. We did not throw it away. ecl_logging_utility is built on top of structlog, which is built on top of logging. Turtles. The interesting question was never whether to wrap the standard library, but what was worth wrapping. Three things, in the order they used to hurt.
The import that moves in like a roommate who pays rent
Inherit a Python service from a team that "just used logging", and you will find the same conceptual event written three different ways:
logger.info("payment %s failed: %s for user %s", payment_id, err, user_id)
logger.info("payment_failed payment_id=%s reason=%s user=%s", payment_id, str(err), user_id)
logger.info(f"Payment {payment_id} failed for {user_id}: {err}")
Three lines. Same fact. Three incompatible shapes. Querying "all payment failures for user 47831" across them is a regex problem, not a database problem — and regex over a string column is how you spend a Saturday afternoon you did not plan to spend.
We wanted structure — every log line a flat document with named fields, not a sentence with values smuggled inside. structlog gives us that. We picked it.
But we also refused to ask anyone to rewrite a single line of caller code. So the public surface of ecl_logging_utility is shaped, deliberately, to match logging:
# before
import logging
logger = logging.getLogger(__name__)
logger.info("payment failed", extra={"payment_id": payment_id})

# after
from ecl_logging_utility import logger
logger.info("payment failed", payment_id=payment_id)
The import changes. Almost nothing else does. Existing services adopted the package by editing one line at the top of their logger module and shipping. No migration sprint. No hundred-file PR. No internal lunch-and-learn. The package walked in the front door, hung up its coat, and started paying rent.
This is the least clever decision in the entire codebase. It is also the only reason adoption ever happened. Clever APIs lose to boring ones, every time.
One place to look. So: OpenSearch.
Even with structured logs, the next question is: where do they go?
We already had logs. They were in AWS CloudWatch. They still are — CloudWatch is the default destination for every container, every Lambda, every ECS task that prints anything. We did not turn it off. CloudWatch has real virtues: zero setup, IAM that already works, configurable retention, log-group permissions that integrate with the rest of AWS. For tailing the stream while a deploy is happening, it is fine. For its price, it is more than fine.
But CloudWatch is a firehose, not a database. Logs Insights, its query language, is a thing you learn under duress. Filters take tens of seconds to come back even on modest result sets. Joining across log groups is awkward. The UI is built for watching the stream go by, not finding the one log line that explains this. If you have ever sat in Logs Insights typing fields @message | filter @message like /payment_id=47831/ and waited eighteen seconds for the result to come back wrong because one of your parentheses was misplaced, you know.
We needed somewhere that the question "show me every log line with this transaction ID, across every service, from the last twelve hours" returned in under a second, with a result set you could pivot, facet, chart, and link to.
We picked OpenSearch.
We could have picked Elasticsearch. They share most of a codebase — OpenSearch is the Apache-2.0 fork that AWS spun out after Elastic relicensed in 2021, and for our use case the two are functionally interchangeable. We chose OpenSearch because
- AWS offers a managed cluster with a sane permissions model
- We already live in AWS, so the data plane was effectively free, and
- The licence posture is friendlier for a private package that downstream teams will inherit.
We do not have strong feelings about the brand. We have strong feelings about the capability — sub-second filtered search across structured logs — and both vendors deliver it. CloudWatch does not.
CloudWatch keeps the raw stream. OpenSearch is where we go to understand it. Two jobs. Both still on the team.
Errors need to find a human.
The third problem is the one we are least proud of, so we are going to lead with it.
Before this package existed, the way we found out about errors in production was:
- A customer noticed.
- The customer messaged support.
- Support paged engineering.
- Engineering looked at the logs.
- Engineering found the error that had been silently happening, in many cases, for hours.
Read that loop again. By step 5, the error had existed all along — it was sitting right there in CloudWatch, faithfully recorded, the whole time. The reason "customer" was step 1 is not that the system had failed to log the error. It was that no developer was informed of it. Our observability was, in effect, our customer support inbox.
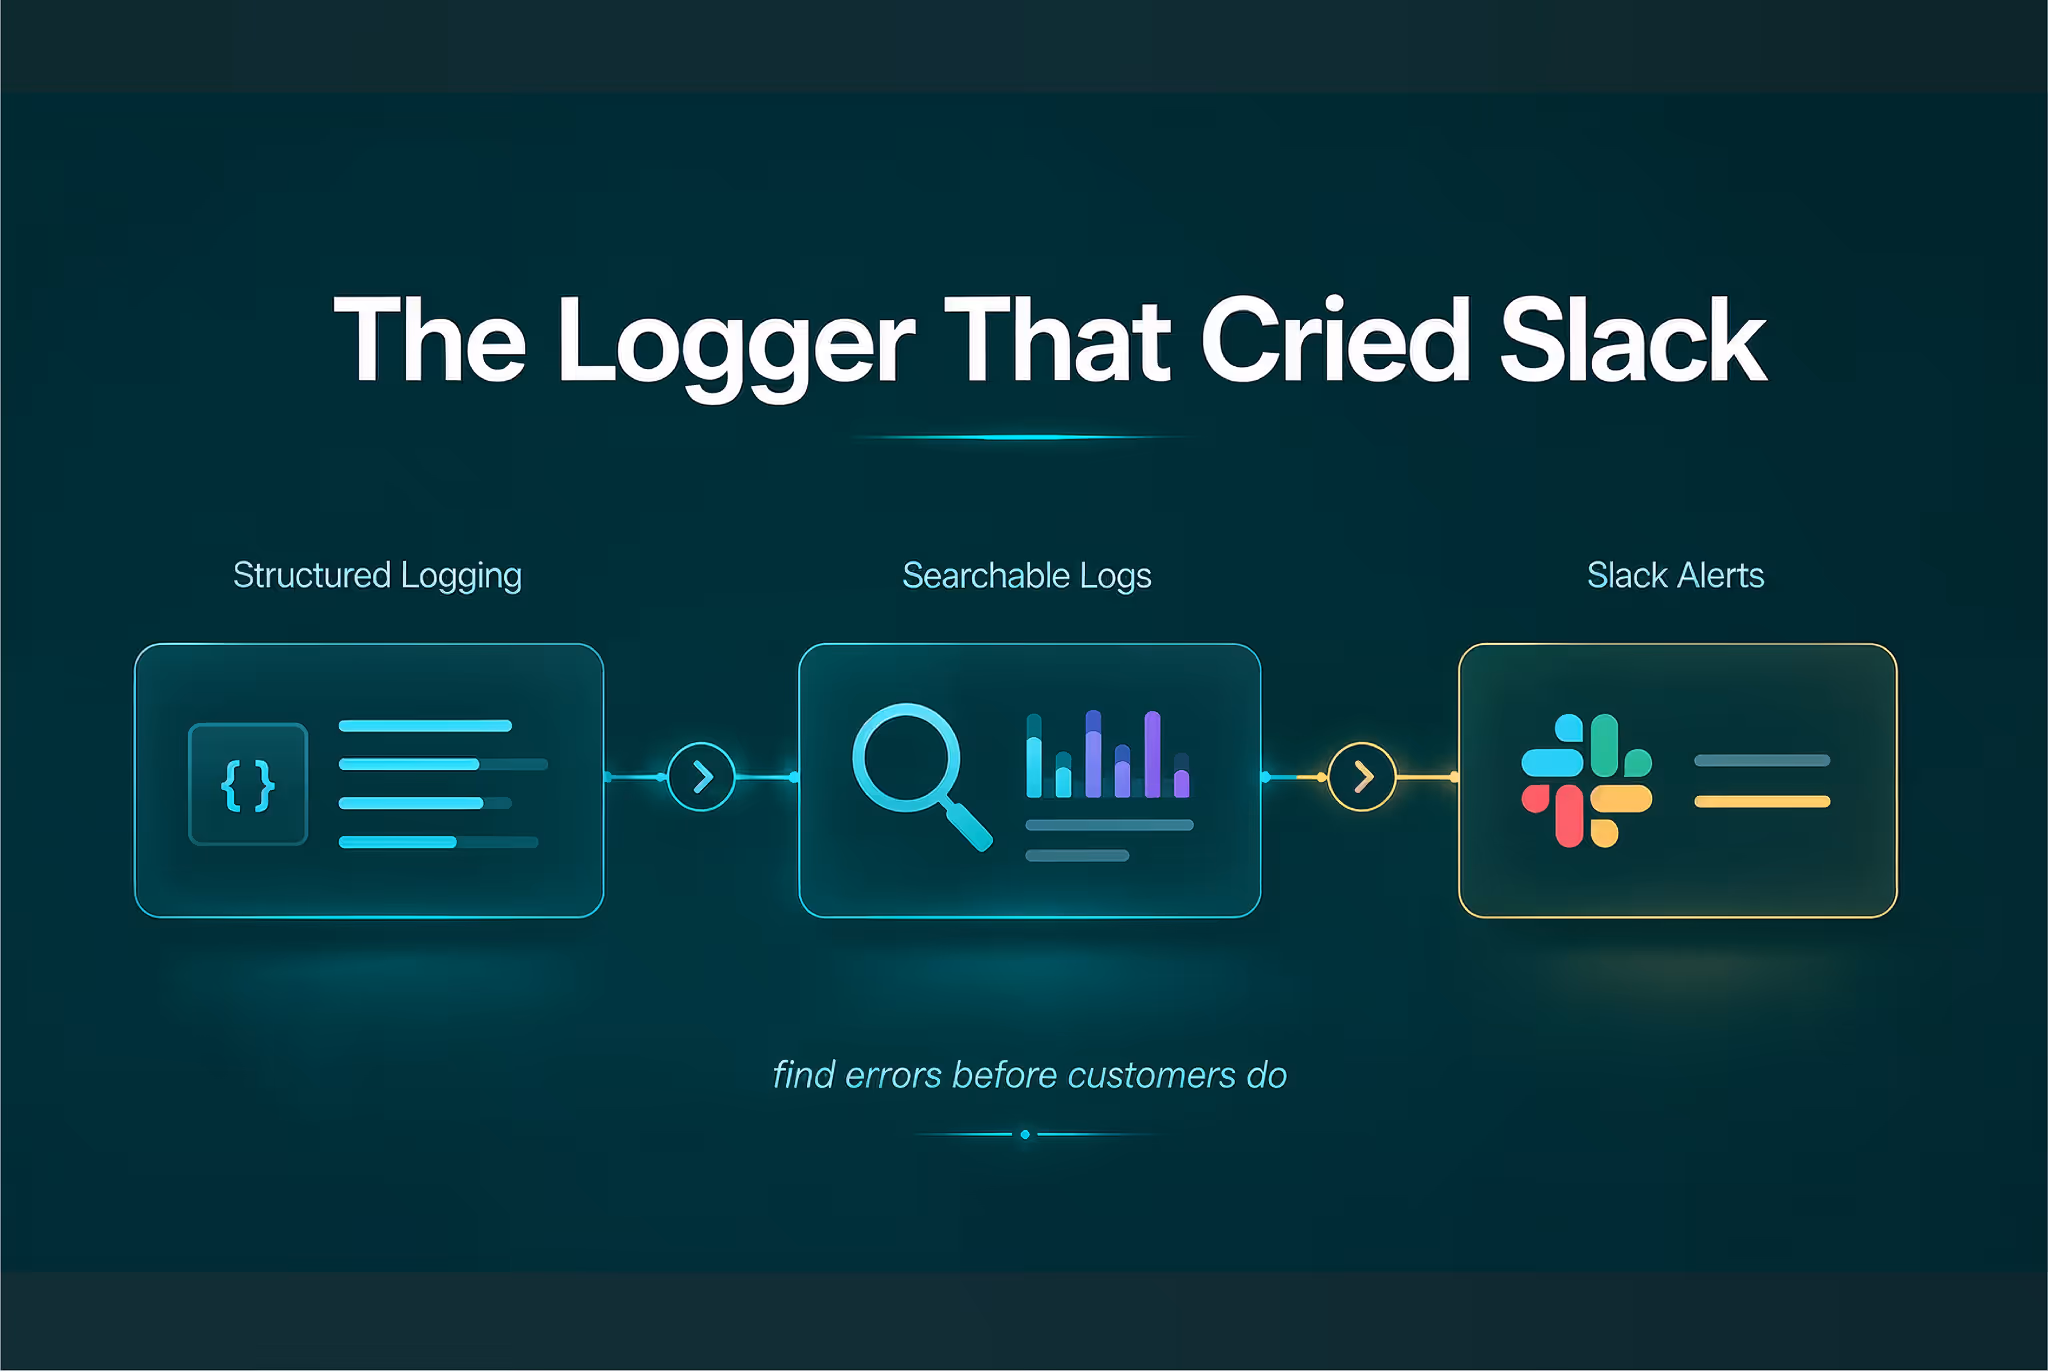
You cannot build a system that learns from its own failures if you only learn about them when a paying customer is annoyed enough to send an email. So we built the Slack hook: every error or critical log fires a notification, on a dedicated channel, with a clickable link straight to the offending log line in OpenSearch.
The number we cared about was time-from-error-to-engineer-awareness. Before the hook existed: hours to days, rate-limited by customer patience. After: seconds, gated only by whether the on-call engineer's phone is on Do Not Disturb.
That single number is the entire business case for the package. The ambivalent constants, the recycled TCP sessions, the cursed Rison URLs you are about to read about — those are texture. The Slack hook is the point.
II. The default service name is AMBIVALENT_SERVICE_NAME
We need to talk about this.
Buried in the constants block of our logging package, in austere PEP-8 capital letters, are two values that haunt us:
DEFAULT_APP_VERSION = 'AMBIVALENT_APP_VERSION'
DEFAULT_SERVICE_NAME = 'AMBIVALENT_SERVICE_NAME'
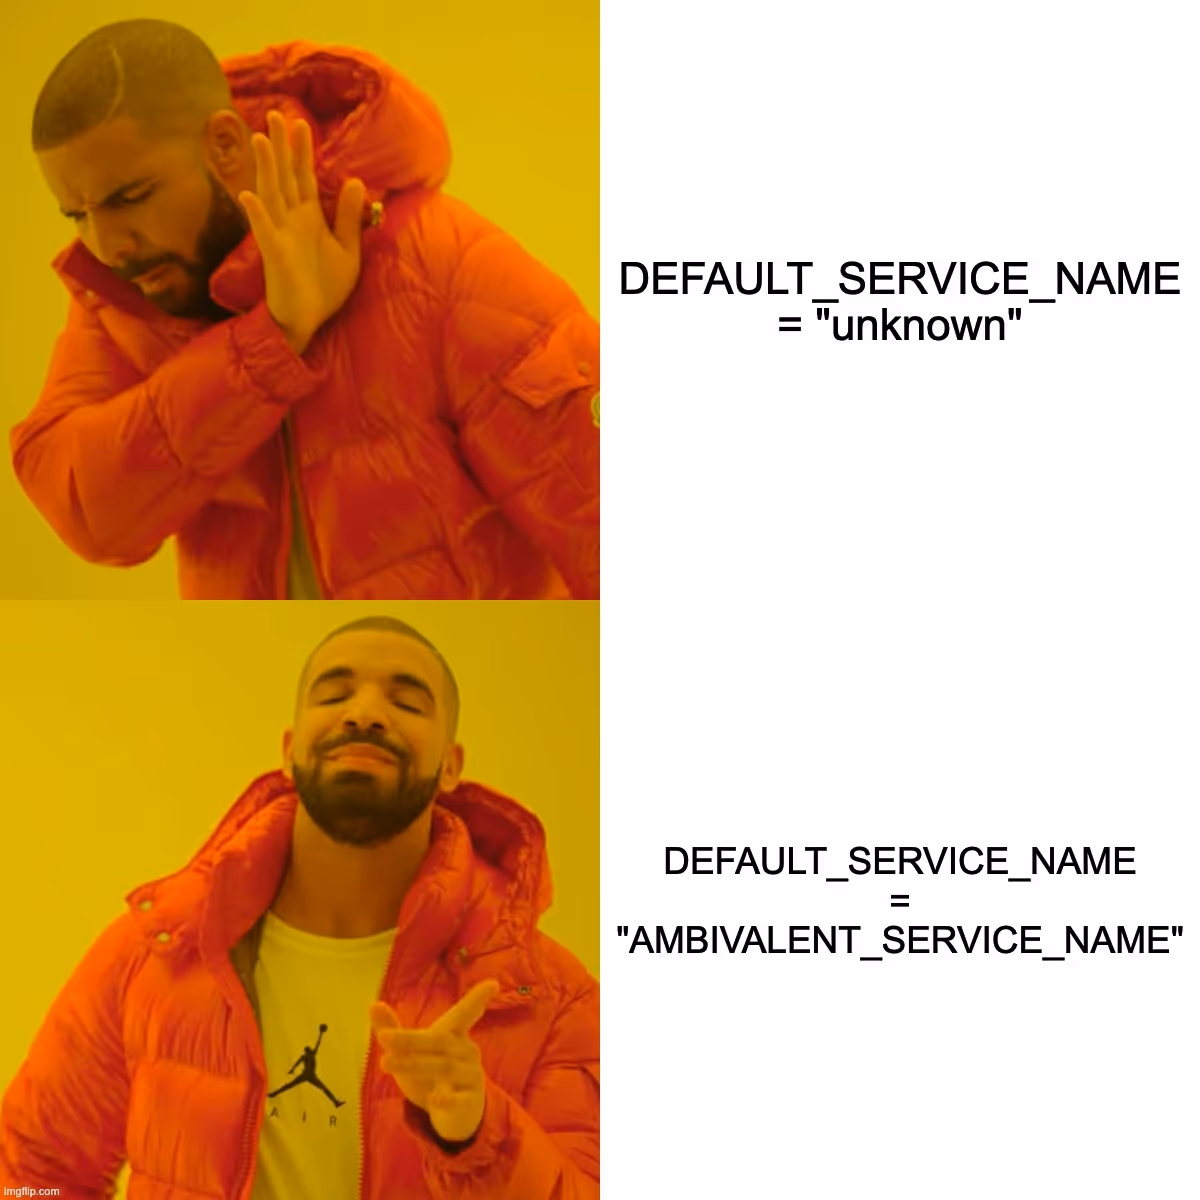
Most libraries default to something polite, "unknown" or "default". A blank string and a shrug. We chose AMBIVALENT, and we chose it on purpose.
Here is what "unknown" actually means in production: I, the engineer, forgot to set an environment variable, and now I have shipped a service that does not know its own name, but my logs look fine because the word "unknown" is grammatically respectable.
AMBIVALENT_SERVICE_NAME, by contrast, screams. It is unignorable. The first time it shows up in your dashboard, you will stop, blink, and immediately go find the missing env var. It is a logger that refuses to dress up its own dysfunction. The default is hostile, so the success path becomes the only comfortable path. We did not invent this principle. But naming the constant AMBIVALENT is, we think, a small piece of code poetry.
There are two kinds of defaults in software: ones that hope you noticed, and ones that ensure you did. We picked a side.
III. The four ways to throw an exception (because backward compatibility is a bi*ch)
Inside the same file, attached to the function that normalises exception info before it's serialised, is a docstring written by a developer in the late stages of the seven stages of grief:
def normalize_exception_info(_, method_name, event_dict):
"""
This function supports the following ways of passing exceptions
(because backward compatibility is a bi*ch)
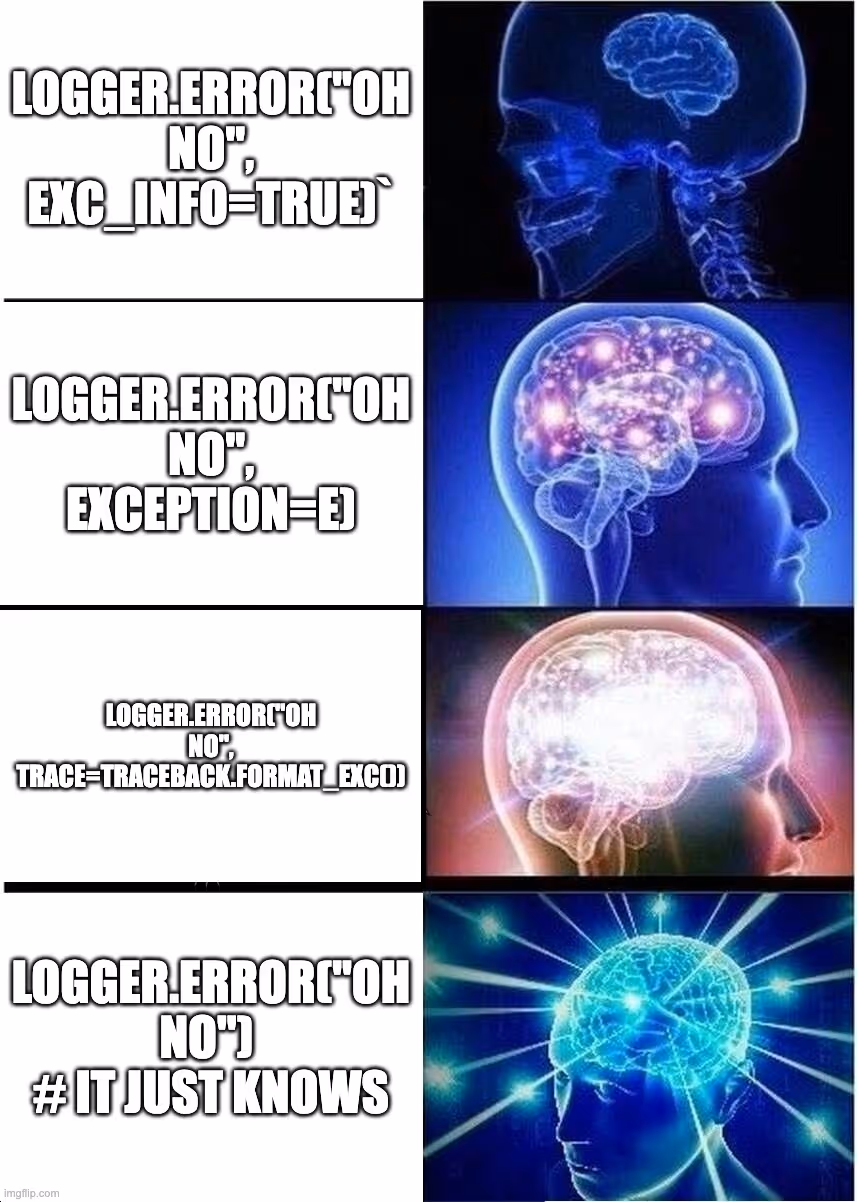
1. exc_info=True/False
2. exception=e (Exception object)
3. trace=traceback.format_string whatever
4. No params - auto-capture from current exception context
(no parameter needed. Big brain move.)
"""
This is not a docstring; it is a confession. It is the kind of comment you write at the end of a Friday after the fourth person in two weeks has asked you why their stack traces aren't showing up in OpenSearch.
The history is short and sad. Early on, callers used logger.error("oh no", exc_info=True), the standard structlog way. Then someone passed exception=e because that felt more Pythonic. Then a third team, working on a celery task with a try/except wrapper of their own, pre-formatted the trace as a string and passed it via trace=. Each of these was, in isolation, a reasonable choice. Together, they formed a small private Tower of Babel inside our error pipeline.
Rather than declare a winner and break four services on a Tuesday afternoon, the function quietly accepts all four. It even has a fourth mode — and this is the part that, depending on your temperament, is either elegant or a fire hazard — where if you call logger.error("something broke") with zero exception arguments, it reaches into sys.exc_info() and grabs the currently-active exception off the runtime, like a magician pulling a rabbit out of a hat you didn't know you were holding.
Inside an except block, this works. The current exception is on the stack, and the logger picks it up automatically. The caller writes one line. The trace shows up in OpenSearch with full fidelity. As the original author noted in the docstring: big brain move.
Outside an except block, this does nothing, and that's also correct. The function is structurally incapable of inventing a stack trace where none exists. We considered this carefully. The rule is: be magical when magic is unambiguous; be inert when it is not.
IV. The day OpenSearch ate itself
Every senior engineer has an OpenSearch horror story, and ours has a CHANGELOG entry:
[1.0.19] - 2026-04-07 — Stringify complex log fields to prevent OpenSearch field explosion.
The polite version: we logged some nested dicts.
The honest version: someone — possibly all of us, over time, collectively — wrote code like this:
logger.info("processed_invoice", payload=invoice.to_dict())
Where invoice.to_dict() returned a dict with thirty keys, six of which were themselves dicts. OpenSearch, being a database that desperately wants to help, dynamically created a mapping for every nested key it saw. payload.line_items.0.tax.jurisdiction.state. payload.metadata.vendor_response.headers.x_request_id. Each one a new field. Each field a slot in the index mapping.
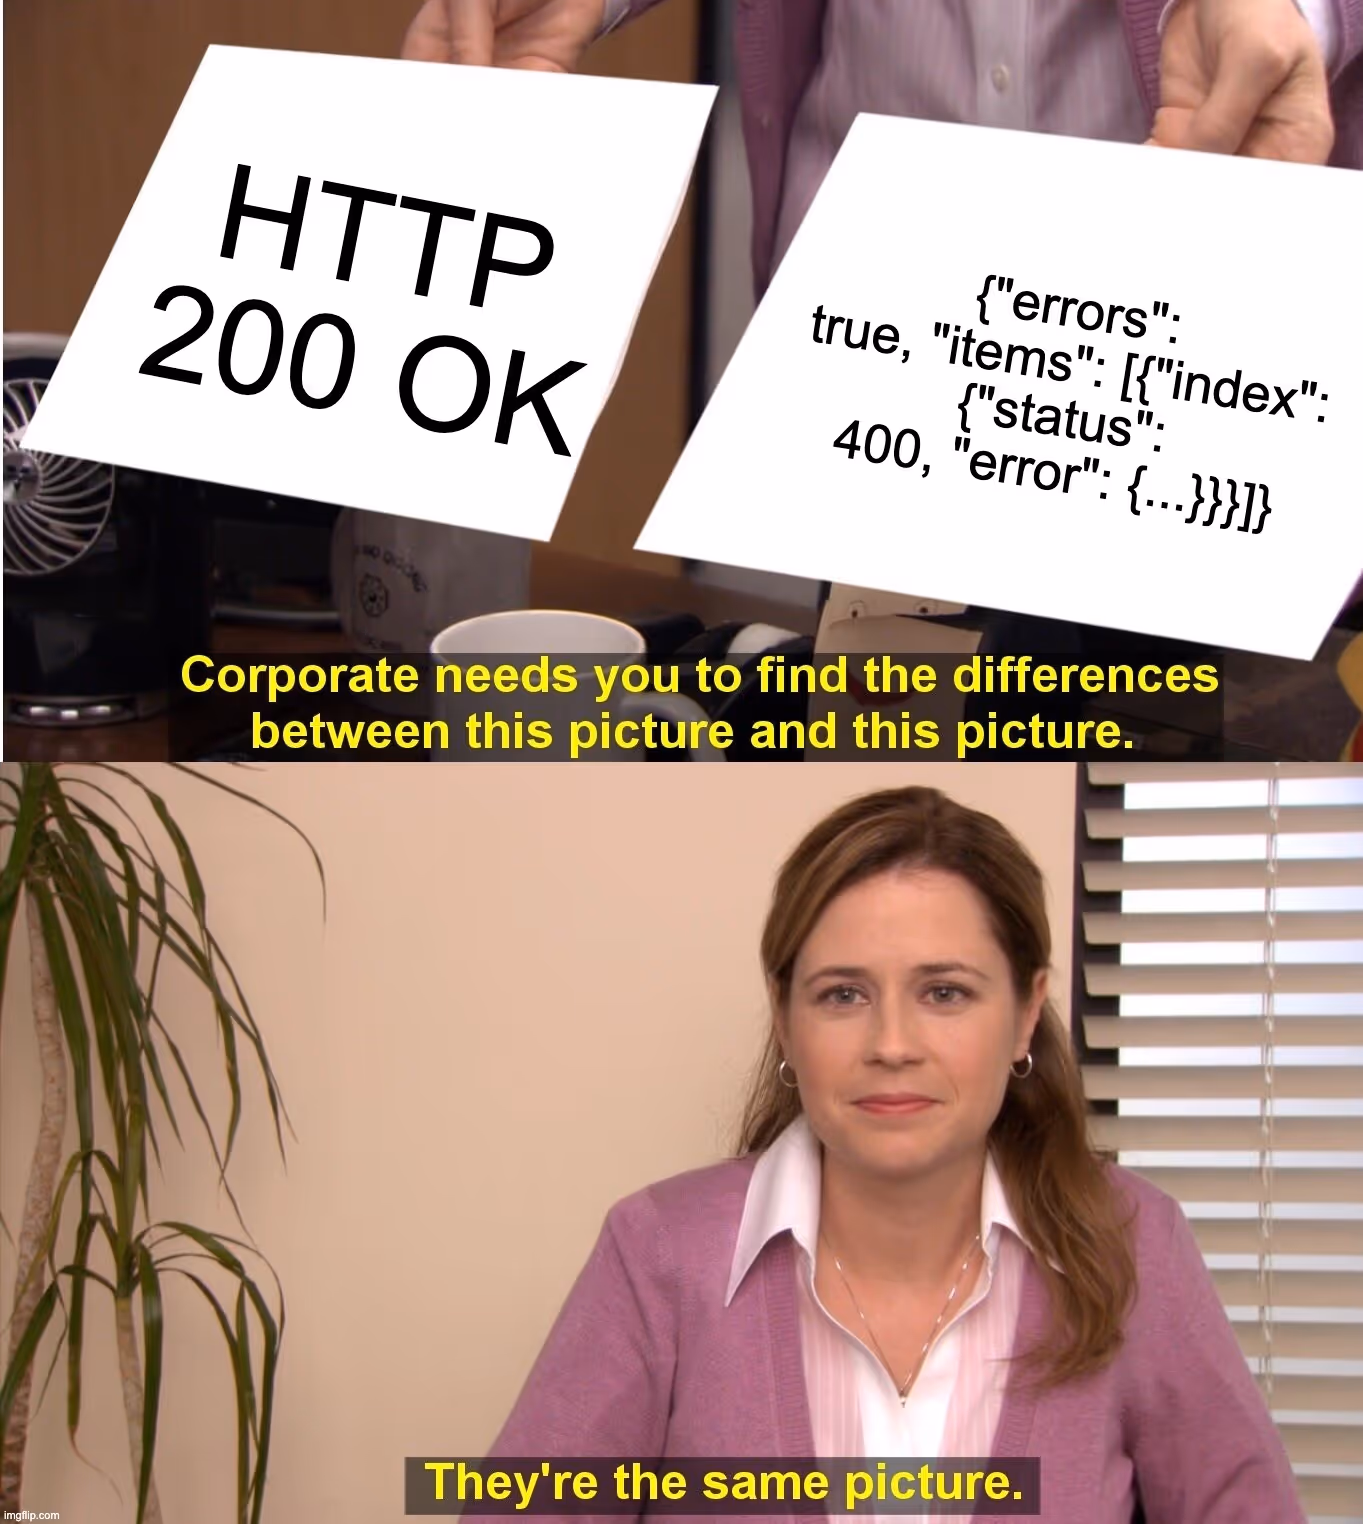
OpenSearch indexes have a default cap of 1,000 fields per index. We hit it. Then we hit it again the next day, on a different index. Then writes started failing silently in batches, because the bulk API will happily accept your log line, reject the underlying document, and return a 200 with a buried errors: true somewhere in the response body — which, by the way, our worker thread now explicitly checks for, because of course it does.

The fix is six lines:
def stringify_complex_values(_, __, event_dict):
    for key, value in event_dict.items():
        if isinstance(value, (dict, list)):
            try:
                event_dict[key] = json.dumps(obj=value, default=str, ensure_ascii=False)
            except (TypeError, ValueError) as e:
                logging.warning(f"Failed to JSON serialize field '{key}': {e}")
                event_dict[key] = str(value)
    return event_dict
Before it leaves the process, any dict or list in the log event gets flattened to a JSON string. OpenSearch sees a single text field per key. The mapping stays sane. You lose nested field-level search — but you keep your cluster, and you keep your job, and frankly, the search still works because every full-text query against the stringified blob still hits.
There is a deeper lesson here that is worth pausing on. A logging library cannot trust its callers. Not because callers are bad — they are colleagues, they are us — but because logging is the one place in your codebase where the cost of a mistake is asymmetric. A bug in your billing code surfaces immediately. A bug in your logger surfaces three weeks later, at 2 am, when you can no longer search the logs that would tell you what's wrong.
Defences live in the logger. Always.
V. The Slack message with a "View Full Log" button
By the time you read this paragraph, an error log fired in any ECL service has already:
- Generated a UUID (
log_id) for itself. - Been pushed to a queue for asynchronous shipment to OpenSearch in batches of ten.
- Been wrapped in a Slack attachment with a clickable button.
- Been posted to the on-call channel — on a daemon thread, so the calling code doesn't block.
- Linked back, via a procedurally generated OpenSearch dashboard URL, to its own exact entry in the index.
The chain looks roughly like this:
logger.error(...)
  │
  ├─→ add_log_id_processor      # mint a UUID
  ├─→ stringify_complex_values  # flatten nested fields
  ├─→ OpenSearchLogger.__call__ # enqueue for async ship
  ├─→ error_handler_processor   # build Slack payload
  │     └─→ Thread(target=...).start()
  └─→ beautified_json_renderer  # pretty-print to stdout
The Slack payload is delightful because it is so utilitarian:
payload = {
    "text": f"🚨 Error in {service_name}",
    "attachments": [{
        "color": "danger",
        "fields": [...],
        "actions": [{
            "type": "button",
            "text": "View Full Log",
            "url": discover_url
        }]
    }]
}
The discover_url is the most cursed string in the codebase, and I mean that affectionately. It is an OpenSearch Dashboard URL constructed by hand, with three URL-encoded mini-state-trees jammed into the hash fragment: _g for global state, _a for app state, _q for query. The query fragment, in particular, looks like this:
q_part = (
    f"(filters:!(('$state':(store:appState),"
    f"meta:(alias:!n,disabled:!f,key:{field_name},negate:!f,"
    f"params:(query:'{field_value}'),type:phrase),"
    f"query:(match_phrase:({field_name}:'{field_value}')))),"
    f"query:(language:kuery,query:''))"
)
If you stare at this long enough, you can almost see the Kibana developer who invented Rison sitting in a dim room going "yes, but what if URLs had... feelings." We build it by hand because OpenSearch does not publish a stable URL contract, and we accept the brittleness because the alternative — engineers manually grep-ing for log IDs at 2 am — is worse.
The button, ultimately, is the whole point. The journey from "Slack pings me" to "I am staring at the offending log line" should be one click. We measured this. It is.
VI. The Slack session that renews itself every five minutes
class SlackSessionManager:
    _instance = None
    _session = None
    _created_time = 0
    RENEWAL_INTERVAL = 300  # 5 minutes
This is a singleton that owns a requests.Session, and it throws the session away every five minutes.
Why? Because requests.Session is a connection pool, and connection pools in long-running Python processes do this thing where the underlying TCP connections get into a state that is technically alive but practically dead — the remote end hung up, the keep-alive timer expired, the load balancer recycled, something — and the next POST blocks for thirty seconds before failing.
Thirty seconds, multiplied by every error log in a busy service, is how you turn a logger into a denial-of-service against your own application.
Recycling the session every five minutes is not elegant. It is a 14-line class that says, in effect: we do not trust the network, we do not trust the pool, and we definitely do not trust the long-running Python process to notice when either of them lies to us. It is the kind of code that gets written once, never gets a blog post written about it (until now), and silently saves the service every time a Slack endpoint blinks.
There is a whole genre of code like this. It is rarely glamorous. It is almost always correct.

VII. What we believe about logging
Eighteen months and nineteen versions in, here is what ecl_logging_utility has taught us. It is not novel. It is not clever. But it is what we believe:
- Logs are not a debugging tool. They are a contract. They are a contract between the engineer who wrote the code and the engineer (often the same person, six months later) who has to understand why production is on fire. Break the contract — by being inconsistent, by being noisy, by being missing — and the contract becomes worthless. So: structure your logs. Schema them. Treat them like an API.
- The logger must never break the application. Every external call in
ecl_logging_utilityis wrapped in a try/except block that silently fails to stderr. The OpenSearch shipment is async. The Slack post is on a daemon thread. The exception-info auto-capture is itself wrapped: "Silently ignore any errors to avoid breaking the logging pipeline." A logger that crashes its host is a logger that has misunderstood its job. - Hostile defaults are kind defaults.
AMBIVALENT_SERVICE_NAMEis hostile. So is settingOPENSEARCH_ENABLEDtoFalse. A library that refuses to silently misbehave is a library that respects you. - Backward compatibility is, in fact, a bi*ch. And it is your job, as a library author, to absorb that pain so your callers don't have to. Four ways to pass an exception are three more than ideal, and zero more than the truth.
- The hardest bugs in distributed systems are the ones you cannot search for. Everything in this utility — the UUIDs, the index pattern UUID, the dashboard URL, the Slack button — exists to make one specific thing fast: finding the log line that explains the page. If your observability stack does not make that fast, it is decorative.
VIII. Coda
There is a line near the end of the configuration function that reads:
wrapper_class=structlog.make_filtering_bound_logger(log_level),
make_filtering_bound_logger. A bound logger. That is what we are doing here. We are binding ourselves — to a schema, to a discipline, to a small set of unglamorous habits about how a backend should narrate itself.
The package name is ecl_logging_utility. It is, on paper, a utility. In practice, it is the small, patient voice in every microservice we run, whispering here is what just happened, here is when, here is where, here is who, and here, attached to this Slack message, is the link.
You will not notice it most days. That is the point.
But the next time you click "View Full Log" from a Slack alert at 2am, and the offending stack trace appears on your screen in under a second — pour one out for stringify_complex_values. It saved your cluster. Quietly. Like good plumbing should.